Getting and Reading Data for Today's Class
Overview
Teaching: 0 min
Exercises: 0 minQuestions
How do I find and read in the data for today’s class?
What is an xarray.Dataset?
Objectives
Getting Started
-
Launch a Jupyter notebook on a COLA server. As a reminder, its best to launch it from your home directory, then you can get to any other directory from within your notebook.
-
Create a new notebook and save it as Subsetting.ipynb
-
Import the standard set of packages we use:
import xarray as xr
import numpy as np
import cartopy.crs as ccrs
import matplotlib.pyplot as plt
Find our Dataset
Today we will work with datasets that are on the COLA servers and findable using the COLA Data Catalog. We will start by using monthly Sea Surface Temperature (SST) data.
Go to the COLA Data Catalog
Browse the main catalog and follow the links to obs->gridded->ocn->sst->oisstv2_monthly
Let’s take a look at our dataset and what we can learn about it from the catalog:
- It is 1deg x 1deg
- Latitudes go from 89.5N to 89.5S – that seems backwards
- It goes from Dec 1981 to Apr 2020
- It was last updated on the COLA Servers on Jun 25, 2020
- It is located in the ‘/shared/obs/gridded/OISSTv2` directory
Now we will take a look at the data on COLA by opening a terminal in our Jupyter Notebook and looking in the directory wehere the data are located:
$ ls /shared/obs/gridded/OISSTv2
lmask monthly weekly
Since we are looking for monthly data, let’s look in the monthly sub-directory. Remember, you can use the up-arrow to avoid having to re-type:
$ ls /shared/obs/gridded/OISSTv2/monthly
sst.mnmean.nc
Quick look at Metadata for our Dataset
What command can you use to look at the metadata for our dataset and confirm that it matches the COLA Data Catalog?
Solution
ncdump -h /shared/obs/gridded/OISSTv2/monthly/sst.mnmean.nc
We can now use cut and paste to put the file and directory information into our notebook and read our dataset using xarray
file='/shared/obs/gridded/OISSTv2/monthly/sst.mnmean.nc'
ds=xr.open_dataset(file)
ds
When we run our cells, we get output that looks exactly like the COLA Data Catalog and the results from ncdump -h
It tells us that we have an xarray.Dataset and gives us all the metadata associated with our data.
What is an xarray.Dataset?
In climate data analysis, we typically work with multidimensional data. By multidimensional data (also often called N-dimensional), I mean data with many independent dimensions or axes. For example, we might represent Earth’s surface temperature T as a three dimensional variable:
T(x,y,t)
where x is longitude, y is latitude, and t is time.
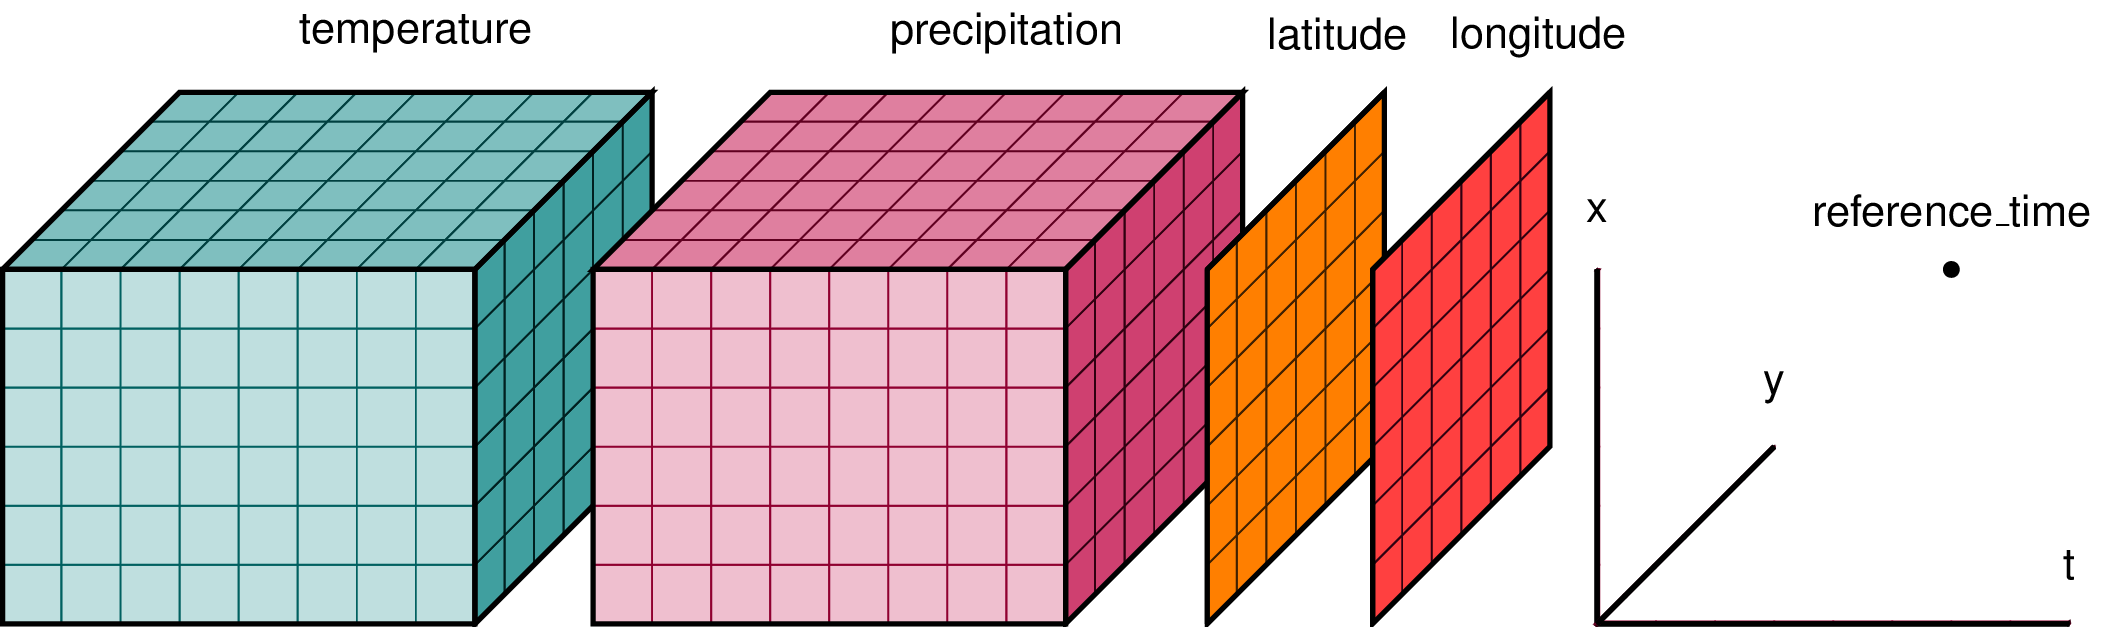
Xarray has two data structures:
- a
DataArraywhich holds a single multi-dimensional variable and its coordinates - a
Datasetwhich can hold multiple variables that potentially share the same coordinates
When we read in our data using xr.open_dataset, we read it in as an xr.Dataset.
A DataArray contains:
- values: a
numpy.ndarrayholdy the array’s values - dims: dimension names for each axis (e.g.
lon,lat,lev,time) - coords: a container of arrays that label each point
- attrs: a container of arbitrary metadata
If we access an individual variable within an xarray.Dataset, we have an xarray.DataArray. Here’s an example:
ds['sst']
you will also see this syntax used
ds.sst
Compare the output for the DataArray and the Dataset
We can access individual attribues attrs of our Dataset using the following syntax:
units=ds['sst'].attrs['units']
print(units)
Using
xarray.Dataset.attrsto label figuresGiven the following lines of code, how would you use
attrsto add units to the colorbar and a title to the map based on theunitsandlong_nameattributes?plt.contourf(ds['sst'][0,:,:]) plt.title(FILLINLONGNAMEHERE) plt.colorbar(label=FILLINUNITSHERE)
The Xarray package provides many convenient functions and tools for working with N-dimensional datasets. We will learn some of them today.
Key Points