Subsetting Data
Overview
Teaching: 0 min
Exercises: 0 minQuestions
How do I extract a particular region from my data?
How do I extract a specific time slice from my data?
Objectives
Subsetting data in Space
Often in our research, we want to look at a specific region defined by a set of latitudes and longitudes.
Conventional approach
We would have an array, like an numpy.ndarray with 3 dimensions, such as lat,lon,time that contains our data. We would need to write nested loops with if statements to find the indices of the latitudes and longitudes we are looking for and then extract out those data to a new array.
This is slow, and has the potential for mistakes if we get the wrong indices. Our data and metadata are disconnected.
xarray makes it possible for us to keep our data and metadata connected and select data based on the dimensions, so we can tell it to extract a specific lat-lon point or select a specific range of lats and lons using the sel function.
Select a point
Let’s try it for a point. We will pick a latitude and longitude in the middle of the Pacific Ocean.
ds_point=ds.sel(lat=0,lon=180,method='nearest')
ds_point
We now have a new xarray.Dataset with all the times and a single latitude and longitude point. All the metadata is carried around with our new Dataset. We can plot this timeseries and label the x-axis with the time information.
plt.plot(ds_point['time'],ds_point['sst'])
Select a Region
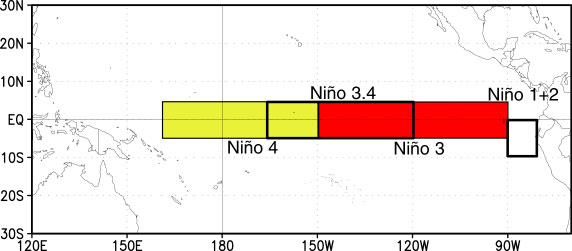
A common region to look at SSTs is the Nino3.4 region. It is defined as 5S-5N; 170W-120W.

Our longitudes are defined by 0 to 360 (as opposed to -180 to 180), so we need to specify our longitudes consistent with that. To select a region we use the sel command with slice
ds_nino34=ds.sel(lon=slice(360-170,360-120),lat=slice(-5,5))
ds_nino34
Notice that we have no latitudes, what happened?
Our data has latitudes going from North to South, but we sliced from South to North. This results in sel finding no latitudes in the range. There are two options to fix this: (1) we can slice in the direction of the latitudes lat=slice(5,-5) or (2) we can reverse the latitudes to go from South to North.
Let’s reverse the latitudes.
ds=ds.reindex(lat=list(reversed(ds['lat'])))
This line reverses the latitudes and then tells xarray to put them back into the latitude coordinate. But, since xarray keeps our metadata attached to our data, we can’t just reverse the latitudes without telling xarray that we want it to attach the reversed latitudes to our data instead of the original latitudes. That’s what the reindex function does.
Now we can slice our data from 5S to 5N
ds_nino34=ds.sel(lon=slice(360-170,360-120),lat=slice(-5,5))
ds_nino34
Now, let’s plot our data
plt.contourf(ds_nino34['lon'],ds_nino34['lat'],
             ds_nino34['sst'][0,:,:],cmap='RdBu_r')
plt.colorbar()
Time Slicing
Sometimes we want to get a particular time slice from our data. Perhaps we have two datasets and we want to select the time slice that is common to both. In this dataset, the data start in Dec 1981 and end in Apr 2020. Suppose we want to extract the times for which we have full years (e.g, Jan 1982 to Dec 2019. We can use the sel function to also select time slices. Let’s select only these times for our ds_nino34 dataset.
ds_nino34=ds_nino34.sel(time=slice('1982-01-01','2019-12-01'))
ds_nino34
Writing data to a file
In this case the dataset is small, but saving off our intermediate datasets is a common step in climate data analysis. This is because our datasets can be very large so we may not want to wait for all our analysis steps to run each time we want to work with this data. We can write out our intermediate data to a file for future use.
It is easy to write an
xarray.Datasetto a netcdf file using theto_netcdf()function.Write out the ds_nino34 dataset to a file in your /scratch directory, like this (replace my username with yours):
ds_nino34.to_netcdf('/scratch/kpegion/nino34_1982-2019.oisstv2.nc')Bring up a terminal window in Jupyter and convince yourself that the file was written and the metatdata is what you expect by using
ncdump
Key Points